

A trustworthy ASR accuracy benchmark must report standardized WER (or CER), a semantic utility metric such as meaning-preservation, efficiency via RTFx and latency, per-dataset breakdowns, subgroup fairness numbers, and reproducible evaluation scripts. For atypical speech or downstream NLP use cases, meaning-preservation scores should be reported alongside WER to reflect true utility. The Open ASR Leaderboard demonstrates this standard in practice, comparing 60+ systems across 10 datasets with normalized scoring and RTFx alongside WER.
- WER/CER establishes a common accuracy baseline, but only when normalization rules are fixed.
- Semantic metrics catch failures that WER misses, particularly for atypical speech where intent survives surface errors.
- RTFx and latency determine whether a model is deployable in real-time or long-form contexts.
- Per-dataset breakdowns prevent a strong LibriSpeech score from masking poor performance on noisy or domain-specific audio.
- Subgroup fairness numbers surface disparities across accents, age groups, and recording conditions.
- Reproducible scripts let reviewers verify results independently, which is the minimum bar for credible publication.
Pro Tip: Before running any evaluation, publish your normalization rules first. Changing them after scoring can shift WER rankings by a relative 20–30%, per SpeechColab’s analysis of pipeline subtleties.
Key Takeaways
Reliable ASR accuracy benchmarks require WER, RTFx, semantic metrics such as meaning-preservation for atypical speech, per-dataset breakdowns, subgroup fairness numbers, and reproducible scripts reported together.
| Point | Details |
|---|---|
| Report WER + RTFx together | Neither metric alone captures the accuracy–efficiency trade-off that determines production fit. |
| Fix normalization before scoring | Normalization choices can shift WER rankings by a relative 20–30%; document rules before running any model. |
| Include subgroup breakdowns | Aggregate WER hides disparities across accents, age groups, and recording conditions that matter in deployment. |
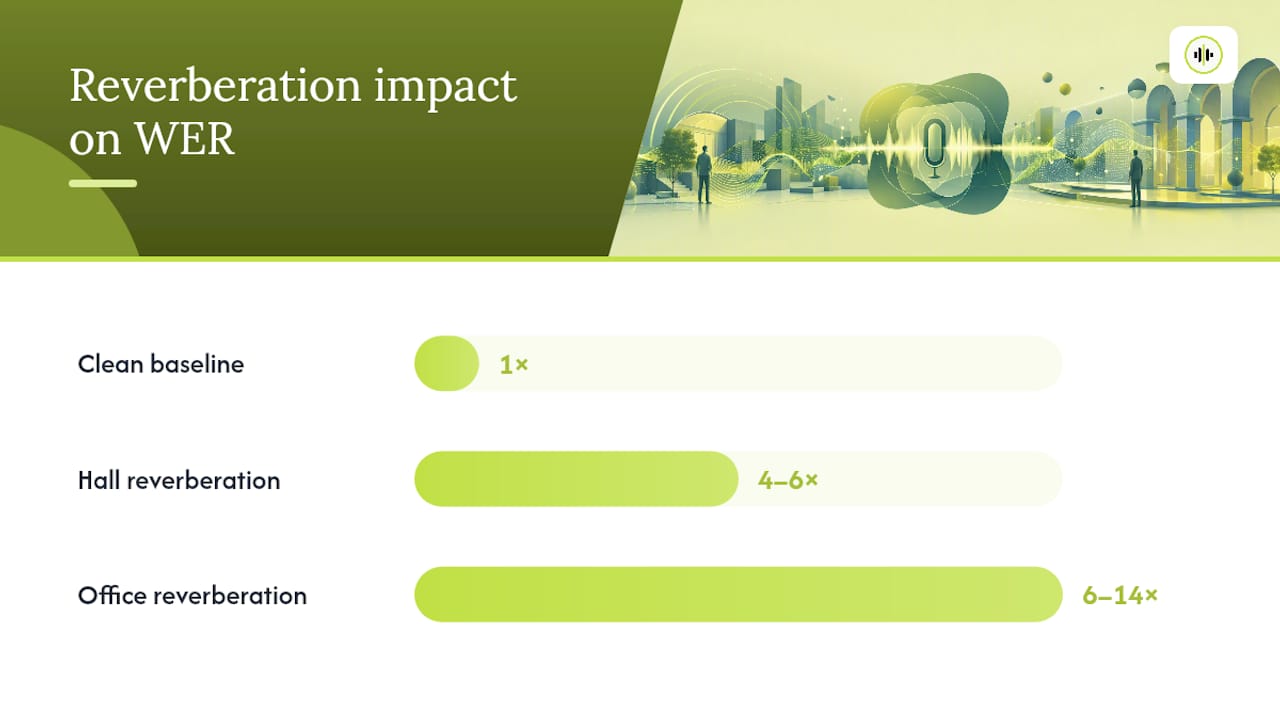
| Test reverberant conditions | Hall and office reverberation can multiply clean WER by 4–14×; clean-audio benchmarks do not predict real-world performance. |
| Use OpenTranscription for production evaluation | OpenTranscription’s 40+ model catalog with per-dataset leaderboards and RTFx reporting covers the full evaluation workflow. |
Table of Contents
- What are the core ASR evaluation metrics and how do you compute them?
- How WER can mislead: demographic, domain, and dataset blind spots
- Which datasets and test sets should you include for robust benchmarking?
- How do you run a fair, reproducible ASR benchmark?
- How do you interpret benchmark numbers and choose the right model?
- What should you publish when you release benchmark results?
- What are the current blind spots in ASR benchmarking?
- OpenTranscription makes reproducible benchmarking production-ready
- The gap between leaderboard rankings and production reality
- Sources
What are the core ASR evaluation metrics and how do you compute them?
Word Error Rate (WER) remains the dominant speech-to-text benchmark metric. It counts substitutions (S), deletions (D), and insertions (I) relative to total reference words (N): WER = (S + D + I) / N. Character Error Rate (CER) applies the same formula at the character level, which is more informative for morphologically rich languages or systems prone to partial-word errors.
Neither metric is meaningful without fixed normalization. For atypical speech, supplement these with meaning-preservation metrics that measure whether semantic intent is retained, as recommended by Google Research. Lowercasing, stripping punctuation, expanding contractions, and handling numerals all affect the denominator and numerator independently. The SpeechColab Leaderboard proposes mTER (modified Token Error Rate) as a symmetric alternative that handles interjections and punctuation more consistently than raw WER.
Inverse real-time factor (RTFx) measures how many seconds of audio a system processes per second of wall-clock time. An RTFx of 10 means the system transcribes 10 seconds of audio per second of compute. Raw latency (time-to-first-token for streaming) is a separate concern: report both RTFx and median/99th-percentile latency when evaluating streaming deployments. The ASR Leaderboard v4, which covers 86 systems across 12 datasets, treats WER and RTFx as co-equal primary metrics precisely because optimizing one often degrades the other.
Semantic/utility metrics measure whether the core meaning of an utterance survives transcription errors. Google Research’s work on meaning preservation argues that for atypical speech, WER often penalizes phonological variation that does not impair comprehension, making meaning-preservation scores more actionable for downstream NLP tasks.
| Metric | What it measures | When to prefer it |
|---|---|---|
| WER | Token-level edit distance vs. reference | Standard accuracy comparison across systems |
| CER | Character-level edit distance | Morphologically rich languages; partial-word errors |
| mTER | Symmetric token error with normalization | When punctuation/interjection handling affects rankings |
| RTFx | Audio seconds processed per compute second | Throughput and cost efficiency |
| Latency (P99) | Time-to-first-token or end-to-end delay | Streaming, real-time agent, and live captioning |
| Meaning preservation | Semantic intent retained despite surface errors | Atypical speech; downstream NLP utility |
Pro Tip: Apply your normalization pipeline to both hypothesis and reference before scoring. Failing to normalize the reference is a common source of artificially inflated WER that makes all models look worse than they are.
How WER can mislead: demographic, domain, and dataset blind spots
A single aggregate WER number conceals where a model actually fails. Researchers consistently recommend computing performance disparities across speaker demographics rather than relying on a top-line average, because models that score well overall can perform significantly worse for specific groups.
Recommended subgroup breakdowns to compute:
- Accent and dialect (e.g., African American Vernacular English, regional US accents, non-native English)
- Age (child speech, older-adult speech)
- Gender
- Recording device (close-talk microphone vs. far-field, mobile vs. studio)
- Domain vocabulary (medical, legal, financial vs. general conversation)
Disparity in practice: Models that achieve strong average WER on clean English benchmarks can show substantially higher error rates on accented or atypical speech, a gap that aggregate leaderboard scores do not expose.
The Google Research meaning-preservation work reinforces this: WER penalizes phonological variation that does not impair comprehension, which means subgroup WER gaps overstate the functional failure for some speaker populations while underreporting it for others.
Pro Tip: Instrument your evaluation pipeline to output per-utterance metadata (speaker ID, accent label, device type) in JSONL format. Slicing WER by group then requires only a groupby operation, not a pipeline rewrite.
Which datasets and test sets should you include for robust benchmarking?
No single dataset covers the full distribution of real-world audio. A credible transcription model benchmarking suite draws from at least four categories.
| Category | Example datasets | Gap covered |
|---|---|---|
| Short-form English | LibriSpeech test-clean/test-other | Baseline accuracy; read speech; clean conditions |
| Long-form | ASR Longform, TED-LIUM | Latency accumulation; speaker drift; punctuation recovery |
| Multilingual | GigaSpeechBench, Common Voice | Language coverage; low-resource performance; dialect variation |
| Noisy/real-world | CHiME-6, CORAAL, AMI | Reverberation; overlapping speech; spontaneous conversation |
| Domain-specific | Medical (e.g., MIMIC notes), Switchboard | Dense terminology; conversational register |
GigaSpeechBench is 680 hours spanning low-resource Middle Eastern and Southeast Asian languages, six Chinese dialects, six English accents, dense domain terminology, and older/child speech. That breadth makes it one of the few benchmarks that simultaneously tests multilingual coverage, accent robustness, and age variation in a single evaluation run. The ASR-Benchmarks repository aggregates historical WERs for classic datasets (WSJ, Switchboard, LibriSpeech) and emphasizes that evaluation units and conditions must be disclosed alongside results.
Dataset selection checklist:
- Confirm no speaker overlap between training and test splits.
- Verify license permits benchmark publication (CC-BY or equivalent).
- Check annotation quality: transcripts produced by non-native annotators introduce reference errors.
- Confirm language and dialect labels are present for subgroup slicing.
- Include at least one reverberant or far-field condition given that reverberation is the dominant acoustic degradation factor in real-world deployments.
How do you run a fair, reproducible ASR benchmark?
Reproducibility requires fixing every variable that affects the score before the first model runs. The Open ASR Leaderboard GitHub repository provides run_eval scripts, dataset loaders, and a Gradio Space that output JSONL predictions with per-utterance metadata, making this the practical reference implementation.
Reproducible evaluation checklist:
- Fix and document the text-normalization pipeline (lowercase, punctuation, numerals, contractions).
- Pin scoring script versions (e.g.,
jiwer==3.0.3). - Disclose hardware: GPU model, CUDA driver, batch size (e.g., NVIDIA A100, CUDA 12.2, batch=16).
- Set and log random seeds for any stochastic decoding steps.
- Run per-dataset evaluations; never report only a macro-average.
- Compute per-subgroup WER slices from the JSONL output.
- Publish raw prediction files and evaluation scripts alongside results.
A minimal run_eval pipeline should output JSONL with at minimum: utterance_id, reference, hypothesis, wer, duration_s, inference_time_s, and any available metadata fields (speaker, accent, device). RTFx is then sum(duration_s) / sum(inference_time_s) across the dataset.
# Pseudocode: compute WER + RTFx from JSONL output
results = load_jsonl("predictions.jsonl")
wer = compute_wer([r.reference for r in results],
                  [r.hypothesis for r in results])
rtfx = sum(r.duration_s for r in results) / \
       sum(r.inference_time_s for r in results)
subgroup_wer = {g: compute_wer(group_refs, group_hyps)
                for g, (group_refs, group_hyps)
                in group_by(results, "accent").items()}
Pro Tip: Report confidence intervals alongside WER, not just point estimates. On small test sets (under 1,000 utterances), a 0.5% WER difference is often within the margin of sampling error.
How do you interpret benchmark numbers and choose the right model?
Prioritize RTFx and P99 latency for streaming and real-time applications; prioritize WER and semantic metrics for high-accuracy transcription or downstream NLP pipelines. The ASR Leaderboard v4 findings make the architecture trade-off explicit: Conformer encoders with transformer or LLM-based decoders achieve the lowest WER, while CTC and TDT decoders deliver substantially higher RTFx at a modest accuracy cost.
| Use case | Primary metrics | Recommended architecture family |
|---|---|---|
| Real-time agent / voice bot | P99 latency, RTFx | CTC or TDT decoder |
| Meeting transcription | WER, diarization accuracy | Conformer + LLM decoder |
| Closed captions / broadcast | WER, latency | Whisper-derived encoder or CTC |
| Research / downstream NLP | WER, mTER, meaning preservation | Conformer + transformer decoder |
| Low-resource multilingual | CER, language coverage | Fine-tuned Whisper variants |
The OpenTranscription model ranker surfaces these trade-offs across 40+ models with per-dataset breakdowns, making it practical to filter by RTFx threshold before comparing WER. For a detailed look at how Whisper-derived encoders behave under fine-tuning, the Whisper large-v3 profile covers encoder/decoder trade-offs in production contexts.
Common misinterpretations to avoid:
- A top rank on LibriSpeech test-clean does not transfer to medical or legal audio with dense domain vocabulary.
- Leaderboard macro-averages can be dominated by large, well-resourced test sets; check per-dataset columns.
- Open-source models allow full reproducibility and custom fine-tuning; closed-source APIs may shift behavior between versions without notice.
- RTFx measured on an A100 does not translate directly to a T4 or CPU-only deployment.
What should you publish when you release benchmark results?
Transparent reporting requires more than a WER table. Every benchmark release should include the following fields.
| Field | What to include |
|---|---|
| Datasets + splits | Name, version, split (test-clean, test-other, etc.) |
| Normalization rules | Script version, lowercase/punctuation/numeral handling |
| Scoring script | Name, version, commit hash |
| Hardware | GPU model, CUDA version, driver |
| Batch size | Per-dataset batch size used |
| Runtime environment | Python version, framework, container image |
| Per-dataset WER | One row per dataset, not just macro-average |
| Subgroup worst-case WER | Worst-performing demographic or condition |
| Median latency / RTFx | Per-dataset or per-condition |
| Confidence intervals | Confidence intervals on WER for each dataset |
| Languages covered | Count and list |
| Raw outputs | Link to JSONL predictions and eval scripts |
The Open ASR Leaderboard repository provides a working example of this disclosure pattern, with dataset loaders and run_eval entry points that produce the artifacts listed above. For acoustic-condition testing methodology, reference track comparison workflows offer a useful parallel for structuring degraded-condition test runs.
What are the current blind spots in ASR benchmarking?
Active research frontiers where current benchmarks still underperform or underreport:
- Child and older-adult speech: Most leaderboards weight adult read speech heavily. GigaSpeechBench includes age-variation modules, but coverage remains thin across most evaluation suites.
- Low-resource languages: Many benchmarks cover fewer than 20 languages. GigaSpeechBench’s Middle Eastern and Southeast Asian modules are among the few public resources targeting this gap.
- Dense domain terminology: Medical, legal, and financial audio requires specialized vocabulary that general benchmarks do not stress-test. The Amazon Transcribe Medical profile illustrates how domain-specific evaluation diverges from general benchmarks.
- Reverberation and real-room acoustics: STT-Bench data shows hall reverberation multiplies clean WER by 4–6× and office reverberation by 6–14×, yet most leaderboards test only clean or mildly noisy conditions.
- Overlapping speech and diarization: Speaker diarization accuracy is rarely co-reported with WER, even though diarization errors propagate directly into transcript quality for multi-speaker recordings.
Pro Tip: When deploying in a reverberant environment (conference rooms, call centers), run your benchmark on degraded audio before committing to a model. A model ranked first on clean audio can drop several positions once room acoustics are introduced.
Community leaderboards like the Open ASR Leaderboard and GigaSpeechBench accept contributions, which is the most direct way to surface gaps in underrepresented languages or conditions.
OpenTranscription makes reproducible benchmarking production-ready
Running the evaluation framework described here requires access to a broad model catalog, standardized scoring infrastructure, and per-dataset reporting. OpenTranscription provides all three in a single API platform, covering 40+ transcription models with per-dataset leaderboards, RTFx and latency reporting, subgroup slicing, and exportable evaluation artifacts.
The workflow is direct: select your target datasets, run a reproducible benchmark via OpenTranscription’s evaluation runner, and publish results with links to scripts and raw JSONL outputs. The platform supports bring-your-own-provider billing and transparent per-second pricing with no subscription lock-in, which matters when benchmarking costs scale with audio volume. For teams ready to move from evaluation to production, the models catalog lists available configurations with accuracy and efficiency metadata. Start a benchmark run at OpenTranscription.
The gap between leaderboard rankings and production reality
The most consistent finding across ASR benchmarking research is that the gap between a model’s leaderboard rank and its production performance is rarely about the model itself. It is almost always about the mismatch between benchmark conditions and deployment conditions: normalization rules that do not match the production pipeline, test sets that lack the domain vocabulary the application actually uses, and clean-audio benchmarks that never encounter the reverberation present in every real conference room or call center. The accuracy–latency trade-off between Conformer+LLM decoders and CTC/TDT architectures is real and well-documented, but choosing the wrong axis to optimize for your use case is a more common failure than picking the wrong architecture. For most production deployments, the right next step is running a benchmark on your own audio, with your own normalization rules, before trusting any published leaderboard number.
Sources
- GigaSpeechBench: A Real-World Multilingual Speech-to-Text Benchmark
- Assessing ASR performance with meaning preservation (Google Research blog)
- SpeechColab Leaderboard: An Open-Source Platform for Automatic Speech Recognition Evaluation